
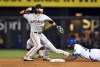
Giants shortstop Brandon Crawford turns a double play during the 2014 World Series. (USA TODAY Sports Images)
Before a game at Yankee Stadium on a Friday in late April, none of the fans trickling into the ballpark seemed to pay any attention to the unassuming black square box now hanging just above the park’s press box. But that box contains radar equipment which, along with a pair of high-definition optical cameras not far away, may soon revolutionize the way fans understand and enjoy the sport. They’re hardly noticeable, but there’s nothing that happens on a baseball field that they won’t notice.
A few hundred feet away, Mike Treanor sits in a production truck beyond the left field wall, near a monitor that tracks on radar the movements of every Yankees player on the field for batting practice. In his role working on MLB Network game broadcasts, Treanor is charged with narrowing a dizzying breadth of on-field data to highlight only information that will seem relevant and accessible to fans still unfamiliar with the technology at his fingertips.
“Regarding pitching, for tonight what we’re going to be focusing on more is the coupling of extension with actual and perceived velocity,” Treanor says. “Extension has a lot to do with the perceived velocity — what the hitter is actually seeing.”
All 30 MLB parks are now equipped with Statcast technology, an innovation years in the making that should eventually provide unprecedented insight into the game and those who play it.

The Statcast radar at Yankee Stadium (USA TODAY Sports)
The radar and cameras don’t just measure the speed of pitches and batted balls, but their spin rates and launch angles. Run through software in the production truck and in MLB Advanced Medias offices in lower Manhattan, they track defensive players’ reaction times, the efficiency of their routes to balls, and the strength of their arms. And they know runners’ top speeds on the basepaths, the size of their leads and the quickness of their first steps.
For now, Statcast exists mostly as a broadcast tool for MLB Network, with the league’s local TV partners expected to have access to the information later this season. And in its nascent form, the technology presents challenges in the form of an overwhelming amount of data that’s still largely devoid of context.
“The key is explaining it, and making sure people understand it,” says Dave Patterson, the head of production at MLB Network. “If you debut something and you don’t define it to the public, they’re going to just tune out.”
Patterson watches a replay cued up inside the production truck showing Cardinals center fielder Jon Jay reacting quickly to chase down a long fly ball.
“Next year, we’ll have a whole year of data,” Patterson says. “So we could do the Top 5 first-step guys in the National League.”
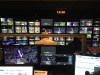
Inside the MLB Network production truck during a Yankees-Mets broadcast in April. (USA TODAY Sports)
Some Statcast leaderboards should be available online by summer, with the raw data expected to be available to the public later this year. Accuracy is paramount, and the league is working with mathematicians at NYU to develop algorithms that validate the data.
In the hands of analytics experts, the huge wealth of heretofore undocumented information seems certain to provide new and improved knowledge of the game and its players.
Stats derived from reasonably accessible data like route efficiency, reaction time and top speed look likely to eventually replace the notoriously finicky defensive metrics that are currently en vogue. And it may well turn out that some figure no one has ever thought to pay much attention better correlates to winning baseball games than many of those we’ve relied on for years.
The relatively limited material already available underscores Statcast’s potential for remarkably insight. A look at a crucial double play turned by the San Francisco Giants in Game 7 of the World Series offers two fascinating conclusions, one logical and one seemingly improbable.
[mlbvideo id=”36879667″ width=”660″ height=”370″ /]
Royals baserunner Eric Hosmer — who would eventually be ruled out at first base on replay review — cost himself the base by diving headfirst where he should have run through. Not sliding into first unless avoiding a tag is Baseball 101, but Statcast offers precise data to back up that fundamental.
And Statcast shows that Giants second baseman Joe Panik, who started the double play with a great diving stop on Hosmer’s grounder, actually broke toward the ball before it was hit, reflecting either incredible instincts, incredible fortune, or some combination of the two.
The league is already providing raw data to its 30 teams, allowing clubs to process the information in the best way they see fit.
“Front offices are drooling at this, because of the way they can evaluate players,” Patterson says. “They’ve already started.
“Teams are talking about it when they’re talking about draft prospects. They’ll look at it when they work guys out, things like that. They’re going to get numbers on guys they never had before.”
[mlbvideo id=”33676413″ width=”660″ height=”370″ /]
A highlight of an extraordinary catch made by Yasiel Puig last season shows the outfielder hitting a top speed of over 21 miles per hour, a pace faster than many people can ride a bike and one not far off from the 23.5 mph rate averaged by Usain Bolt in his record-breaking 100-meter dash.
Everyone who has watched Puig play already realizes he is fast. But in 2015, for the first time, we will know exactly how fast he is and how that compares to his competition around the league. And sometime soon, we’ll better understand how important Puig’s speed is to his defense in right field.
Maybe we’ll learn that top speed is the single best determining factor for an outfielder’s value to his team, or maybe we’ll learn that a slower guy can cover way more ground if he has reliably impeccable route efficiency. Maybe we’ll learn there’s some optimal launch angle for batted balls to become home runs, or some perfect ratio of perceived fastball velocity to spin rate that helps pitchers dominant.
The point is, we’ll learn. And for those rabid members of the MLB fanbase that crave every bit of information possible for understanding the game, Statcast represents a massive step forward. These are the first days of a whole new era for baseball stats.
(A previous version of this story said Puig’s catch against the Mets happened earlier this season. It happened in 2014.)


